Examples
This section provides practical code examples for common use cases of the PyGeoHash library.
Basic Geohashing
Converting between coordinates and geohashes:
import pygeohash as pgh

# Define some locations
locations = {
    "San Francisco": (37.7749, -122.4194),
    "New York": (40.7128, -74.0060),
    "Tokyo": (35.6762, 139.6503),
    "Sydney": (-33.8688, 151.2093),
    "Rio de Janeiro": (-22.9068, -43.1729)
}

# Encode each location with different precision levels
for name, (lat, lng) in locations.items():
    print(f"\n{name}:")
    for precision in [4, 6, 8, 10]:
        geohash = pgh.encode(lat, lng, precision=precision)
        print(f"  Precision {precision}: {geohash}")

# Decode a geohash back to coordinates
geohash = "9q8yyk8yuv"  # San Francisco with precision 10
location = pgh.decode(geohash)
print(f"\nDecoded {geohash}: ({location.latitude}, {location.longitude})")

# Get exact decoding with error margins
exact = pgh.decode_exactly(geohash)
print(f"Error margins: ±{exact.latitude_error}° latitude, ±{exact.longitude_error}° longitude")
Adjacent Geohashes
Working with adjacent geohashes:
import pygeohash as pgh

# Get adjacent geohashes in all four directions
geohash = "9q8yyk"  # San Francisco

adjacent_top = pgh.get_adjacent(geohash, 'top')
adjacent_right = pgh.get_adjacent(geohash, 'right')
adjacent_bottom = pgh.get_adjacent(geohash, 'bottom')
adjacent_left = pgh.get_adjacent(geohash, 'left')

print(f"Original: {geohash}")
print(f"Top: {adjacent_top}")
print(f"Right: {adjacent_right}")
print(f"Bottom: {adjacent_bottom}")
print(f"Left: {adjacent_left}")

# Create a simple 3x3 grid of geohashes
def create_simple_grid(center_geohash):
    grid = [
        [None, None, None],
        [None, center_geohash, None],
        [None, None, None]
    ]

    # Fill in the grid
    # Top row
    grid[0][1] = pgh.get_adjacent(center_geohash, 'top')
    grid[0][0] = pgh.get_adjacent(grid[0][1], 'left')
    grid[0][2] = pgh.get_adjacent(grid[0][1], 'right')

    # Middle row
    grid[1][0] = pgh.get_adjacent(center_geohash, 'left')
    grid[1][2] = pgh.get_adjacent(center_geohash, 'right')

    # Bottom row
    grid[2][1] = pgh.get_adjacent(center_geohash, 'bottom')
    grid[2][0] = pgh.get_adjacent(grid[2][1], 'left')
    grid[2][2] = pgh.get_adjacent(grid[2][1], 'right')

    return grid

# Create and print the grid
grid = create_simple_grid(geohash)
print("\nGeohash Grid:")
for row in grid:
    print(" ".join(row))
Distance Calculations
Calculating distances between geohashes:
import pygeohash as pgh

# Define some locations with their geohashes
locations = {
    "San Francisco": "9q8yyk",
    "Los Angeles": "9q5cd",
    "New York": "dr5reg",
    "London": "gcpvj",
    "Tokyo": "xn76ur"
}

# Calculate distances between San Francisco and other cities
sf = locations["San Francisco"]

print("Distances from San Francisco:")
for city, geohash in locations.items():
    if city != "San Francisco":
        # Approximate distance (based on matching characters)
        approx_distance = pgh.geohash_approximate_distance(sf, geohash)

        # More accurate distance (using Haversine formula)
        haversine_distance = pgh.geohash_haversine_distance(sf, geohash)

        print(f"{city}:")
        print(f"  Approximate: {approx_distance/1000:.1f} km")
        print(f"  Haversine: {haversine_distance/1000:.1f} km")
Statistical Analysis
Using statistical functions with geohashes:
import pygeohash as pgh
import random

# Generate a cluster of geohashes around San Francisco
def generate_cluster(center_lat, center_lng, count=20, spread=0.1, precision=6):
    geohashes = []
    for _ in range(count):
        # Add some random variation
        lat = center_lat + (random.random() - 0.5) * spread
        lng = center_lng + (random.random() - 0.5) * spread
        geohashes.append(pgh.encode(lat, lng, precision=precision))
    return geohashes

# Generate clusters
sf_cluster = generate_cluster(37.7749, -122.4194, count=20, spread=0.1)
ny_cluster = generate_cluster(40.7128, -74.0060, count=15, spread=0.08)

# Analyze San Francisco cluster
print("San Francisco Cluster Analysis:")
print(f"Number of points: {len(sf_cluster)}")

# Find the mean position
mean_position = pgh.mean(sf_cluster)
mean_coords = pgh.decode(mean_position)
print(f"Mean position: {mean_position} ({mean_coords.latitude}, {mean_coords.longitude})")

# Find cardinal extremes
north = pgh.northern(sf_cluster)
south = pgh.southern(sf_cluster)
east = pgh.eastern(sf_cluster)
west = pgh.western(sf_cluster)

print(f"Northernmost: {north}")
print(f"Southernmost: {south}")
print(f"Easternmost: {east}")
print(f"Westernmost: {west}")

# Calculate statistical measures
variance = pgh.variance(sf_cluster)
std_dev = pgh.std(sf_cluster)

print(f"Variance: {variance:.2f} m²")
print(f"Standard deviation: {std_dev:.2f} m")

# Compare the two clusters
sf_mean = pgh.mean(sf_cluster)
ny_mean = pgh.mean(ny_cluster)

distance = pgh.geohash_haversine_distance(sf_mean, ny_mean)
print(f"\nDistance between cluster means: {distance/1000:.1f} km")
Geospatial Search
Implementing a simple geospatial search using geohashes:
import pygeohash as pgh
from collections import defaultdict

class SimpleGeohashIndex:
    """A simple geospatial index using geohashes."""

    def __init__(self, precision=5):
        self.precision = precision
        self.index = defaultdict(list)

    def add_point(self, id, lat, lng, data=None):
        """Add a point to the index."""
        geohash = pgh.encode(lat, lng, precision=self.precision)
        self.index[geohash].append({
            'id': id,
            'lat': lat,
            'lng': lng,
            'geohash': geohash,
            'data': data or {}
        })

    def search_nearby(self, lat, lng, radius_km=10):
        """
        Search for points near the given coordinates.
        This is a simplified approach that checks adjacent cells.
        """
        # Get the geohash of the search point
        center_geohash = pgh.encode(lat, lng, precision=self.precision)

        # Get adjacent geohashes
        adjacent = [center_geohash]
        for direction in ['top', 'right', 'bottom', 'left']:
            adjacent.append(pgh.get_adjacent(center_geohash, direction))

        # Add diagonal adjacents
        top = pgh.get_adjacent(center_geohash, 'top')
        right = pgh.get_adjacent(center_geohash, 'right')
        bottom = pgh.get_adjacent(center_geohash, 'bottom')
        left = pgh.get_adjacent(center_geohash, 'left')

        adjacent.append(pgh.get_adjacent(top, 'right'))     # top-right
        adjacent.append(pgh.get_adjacent(right, 'bottom'))  # bottom-right
        adjacent.append(pgh.get_adjacent(bottom, 'left'))   # bottom-left
        adjacent.append(pgh.get_adjacent(left, 'top'))      # top-left

        # Collect all points in the search geohashes
        results = []
        for gh in adjacent:
            for point in self.index.get(gh, []):
                # Calculate actual distance
                distance = pgh.geohash_haversine_distance(
                    pgh.encode(lat, lng, precision=self.precision),
                    point['geohash']
                ) / 1000  # Convert to km

                if distance <= radius_km:
                    results.append({
                        **point,
                        'distance_km': distance
                    })

        # Sort by distance
        results.sort(key=lambda x: x['distance_km'])
        return results

# Example usage
index = SimpleGeohashIndex(precision=5)

# Add some points
cities = [
    {"id": 1, "name": "San Francisco", "lat": 37.7749, "lng": -122.4194},
    {"id": 2, "name": "Oakland", "lat": 37.8044, "lng": -122.2711},
    {"id": 3, "name": "Berkeley", "lat": 37.8715, "lng": -122.2730},
    {"id": 4, "name": "San Jose", "lat": 37.3382, "lng": -121.8863},
    {"id": 5, "name": "Los Angeles", "lat": 34.0522, "lng": -118.2437}
]

for city in cities:
    index.add_point(city["id"], city["lat"], city["lng"], {"name": city["name"]})

# Search for cities within 50km of San Francisco
results = index.search_nearby(37.7749, -122.4194, radius_km=50)

print("Cities within 50km of San Francisco:")
for result in results:
    print(f"{result['data']['name']}: {result['distance_km']:.2f} km")
Clustering by Geohash Prefix
Clustering points by their geohash prefixes:
import pygeohash as pgh
from collections import defaultdict

def cluster_by_geohash_prefix(points, prefix_length=3):
    """
    Cluster points by their geohash prefixes.

    Args:
        points: List of (lat, lng) tuples
        prefix_length: Length of geohash prefix to use for clustering

    Returns:
        Dictionary mapping geohash prefixes to lists of points
    """
    clusters = defaultdict(list)

    for i, (lat, lng) in enumerate(points):
        geohash = pgh.encode(lat, lng, precision=6)
        prefix = geohash[:prefix_length]
        clusters[prefix].append({
            'id': i,
            'lat': lat,
            'lng': lng,
            'geohash': geohash
        })

    return clusters

# Generate some random points around the world
import random
random.seed(42)  # For reproducibility

points = []
for _ in range(100):
    lat = random.uniform(-90, 90)
    lng = random.uniform(-180, 180)
    points.append((lat, lng))

# Cluster the points
clusters = cluster_by_geohash_prefix(points, prefix_length=2)

# Print the clusters
print(f"Found {len(clusters)} clusters:")
for prefix, points in sorted(clusters.items(), key=lambda x: len(x[1]), reverse=True):
    print(f"Cluster {prefix}: {len(points)} points")

# Print details of the largest cluster
largest_cluster = max(clusters.items(), key=lambda x: len(x[1]))
print(f"\nDetails of largest cluster ({largest_cluster[0]}):")
for point in largest_cluster[1][:5]:  # Show first 5 points
    print(f"  Point {point['id']}: ({point['lat']:.4f}, {point['lng']:.4f})")
if len(largest_cluster[1]) > 5:
    print(f"  ... and {len(largest_cluster[1]) - 5} more points")
# Get the standard deviation of the geohashes std_dev = pgh.std(geohashes) print(f”Standard deviation: {std_dev:.2f} meters”)
Bounding Box Operations
Working with geohash bounding boxes:
import pygeohash as pgh

# Get bounding box for a geohash
geohash = "9q8yy"  # San Francisco area
bbox = pgh.get_bounding_box(geohash)

print(f"Bounding box for {geohash}:")
print(f"  Southwest corner: ({bbox.min_lat}, {bbox.min_lon})")
print(f"  Northeast corner: ({bbox.max_lat}, {bbox.max_lon})")

# Check if a point is within the bounding box
test_points = [
    ("Golden Gate Bridge", 37.8199, -122.4783),
    ("Fisherman's Wharf", 37.8080, -122.4177),
    ("San Jose", 37.3382, -121.8863)
]

for name, lat, lon in test_points:
    is_in_box = pgh.is_point_in_box(lat, lon, bbox)
    is_in_geohash = pgh.is_point_in_geohash(lat, lon, geohash)
    print(f"{name} ({lat}, {lon}):")
    print(f"  In bounding box: {is_in_box}")
    print(f"  In geohash: {is_in_geohash}")

# Find all geohashes within a custom bounding box
custom_bbox = pgh.BoundingBox(
    min_lat=37.75, min_lon=-122.45,
    max_lat=37.78, max_lon=-122.40
)

# Get geohashes at different precision levels
for precision in [5, 6, 7]:
    geohashes = pgh.geohashes_in_box(custom_bbox, precision=precision)
    print(f"Precision {precision}: found {len(geohashes)} geohashes")
    if precision == 5:
        print(f"  Geohashes: {', '.join(geohashes)}")

# Check if two bounding boxes intersect
bbox1 = pgh.get_bounding_box("9q8yyk")
bbox2 = pgh.get_bounding_box("9q8yym")
bbox3 = pgh.get_bounding_box("dr5r")  # New York

print(f"Intersection of 9q8yyk and 9q8yym: {pgh.do_boxes_intersect(bbox1, bbox2)}")
print(f"Intersection of 9q8yyk and dr5r: {pgh.do_boxes_intersect(bbox1, bbox3)}")
Visualizing Bounding Boxes
Visualizing geohash bounding boxes with matplotlib:
import pygeohash as pgh
import matplotlib.pyplot as plt
import matplotlib.patches as patches

# Define a base geohash and get its bounding box
base_geohash = "9q8yy"  # San Francisco area
base_bbox = pgh.get_bounding_box(base_geohash)

# Find geohashes within this area at a higher precision
geohashes = pgh.geohashes_in_box(base_bbox, precision=6)

# Create a figure and axis
fig, ax = plt.subplots(figsize=(10, 8))

# Plot the base bounding box
base_width = base_bbox.max_lon - base_bbox.min_lon
base_height = base_bbox.max_lat - base_bbox.min_lat
base_rect = patches.Rectangle(
    (base_bbox.min_lon, base_bbox.min_lat),
    base_width, base_height,
    linewidth=2, edgecolor='blue', facecolor='none',
    label=f'Base Geohash: {base_geohash}'
)
ax.add_patch(base_rect)

# Plot each geohash's bounding box
for gh in geohashes[:10]:  # Limit to first 10 for clarity
    gh_bbox = pgh.get_bounding_box(gh)
    width = gh_bbox.max_lon - gh_bbox.min_lon
    height = gh_bbox.max_lat - gh_bbox.min_lat

    rect = patches.Rectangle(
        (gh_bbox.min_lon, gh_bbox.min_lat),
        width, height,
        linewidth=1, edgecolor='red', facecolor='red', alpha=0.2
    )
    ax.add_patch(rect)

    # Add geohash label at center of box
    center_x = gh_bbox.min_lon + width/2
    center_y = gh_bbox.min_lat + height/2
    ax.text(center_x, center_y, gh, ha='center', va='center', fontsize=8)

# Set plot limits and labels
ax.set_xlim(base_bbox.min_lon - 0.05, base_bbox.max_lon + 0.05)
ax.set_ylim(base_bbox.min_lat - 0.05, base_bbox.max_lat + 0.05)
ax.set_xlabel('Longitude')
ax.set_ylabel('Latitude')
ax.set_title(f'Geohashes within {base_geohash}')
ax.legend()

plt.tight_layout()
plt.show()
Visualization Examples
PyGeoHash provides visualization capabilities through the optional viz module.
To use these functions, you need to install the visualization dependencies:
pip install pygeohash[viz]
You can generate all the example visualizations shown below using the provided Makefile command:
# Install visualization dependencies
make install-viz

# Generate visualization examples
make viz-examples
This will create static images and interactive maps in the docs/source/_static/images directory.
import pygeohash as pgh
from pygeohash.viz import plot_geohash
import matplotlib.pyplot as plt

# Plot a single geohash
fig, ax = plot_geohash("9q8yyk", color="red", alpha=0.5)
plt.show()

# Plot with center point and label
fig, ax = plot_geohash("9q8yyk", show_center=True, show_label=True)
plt.show()
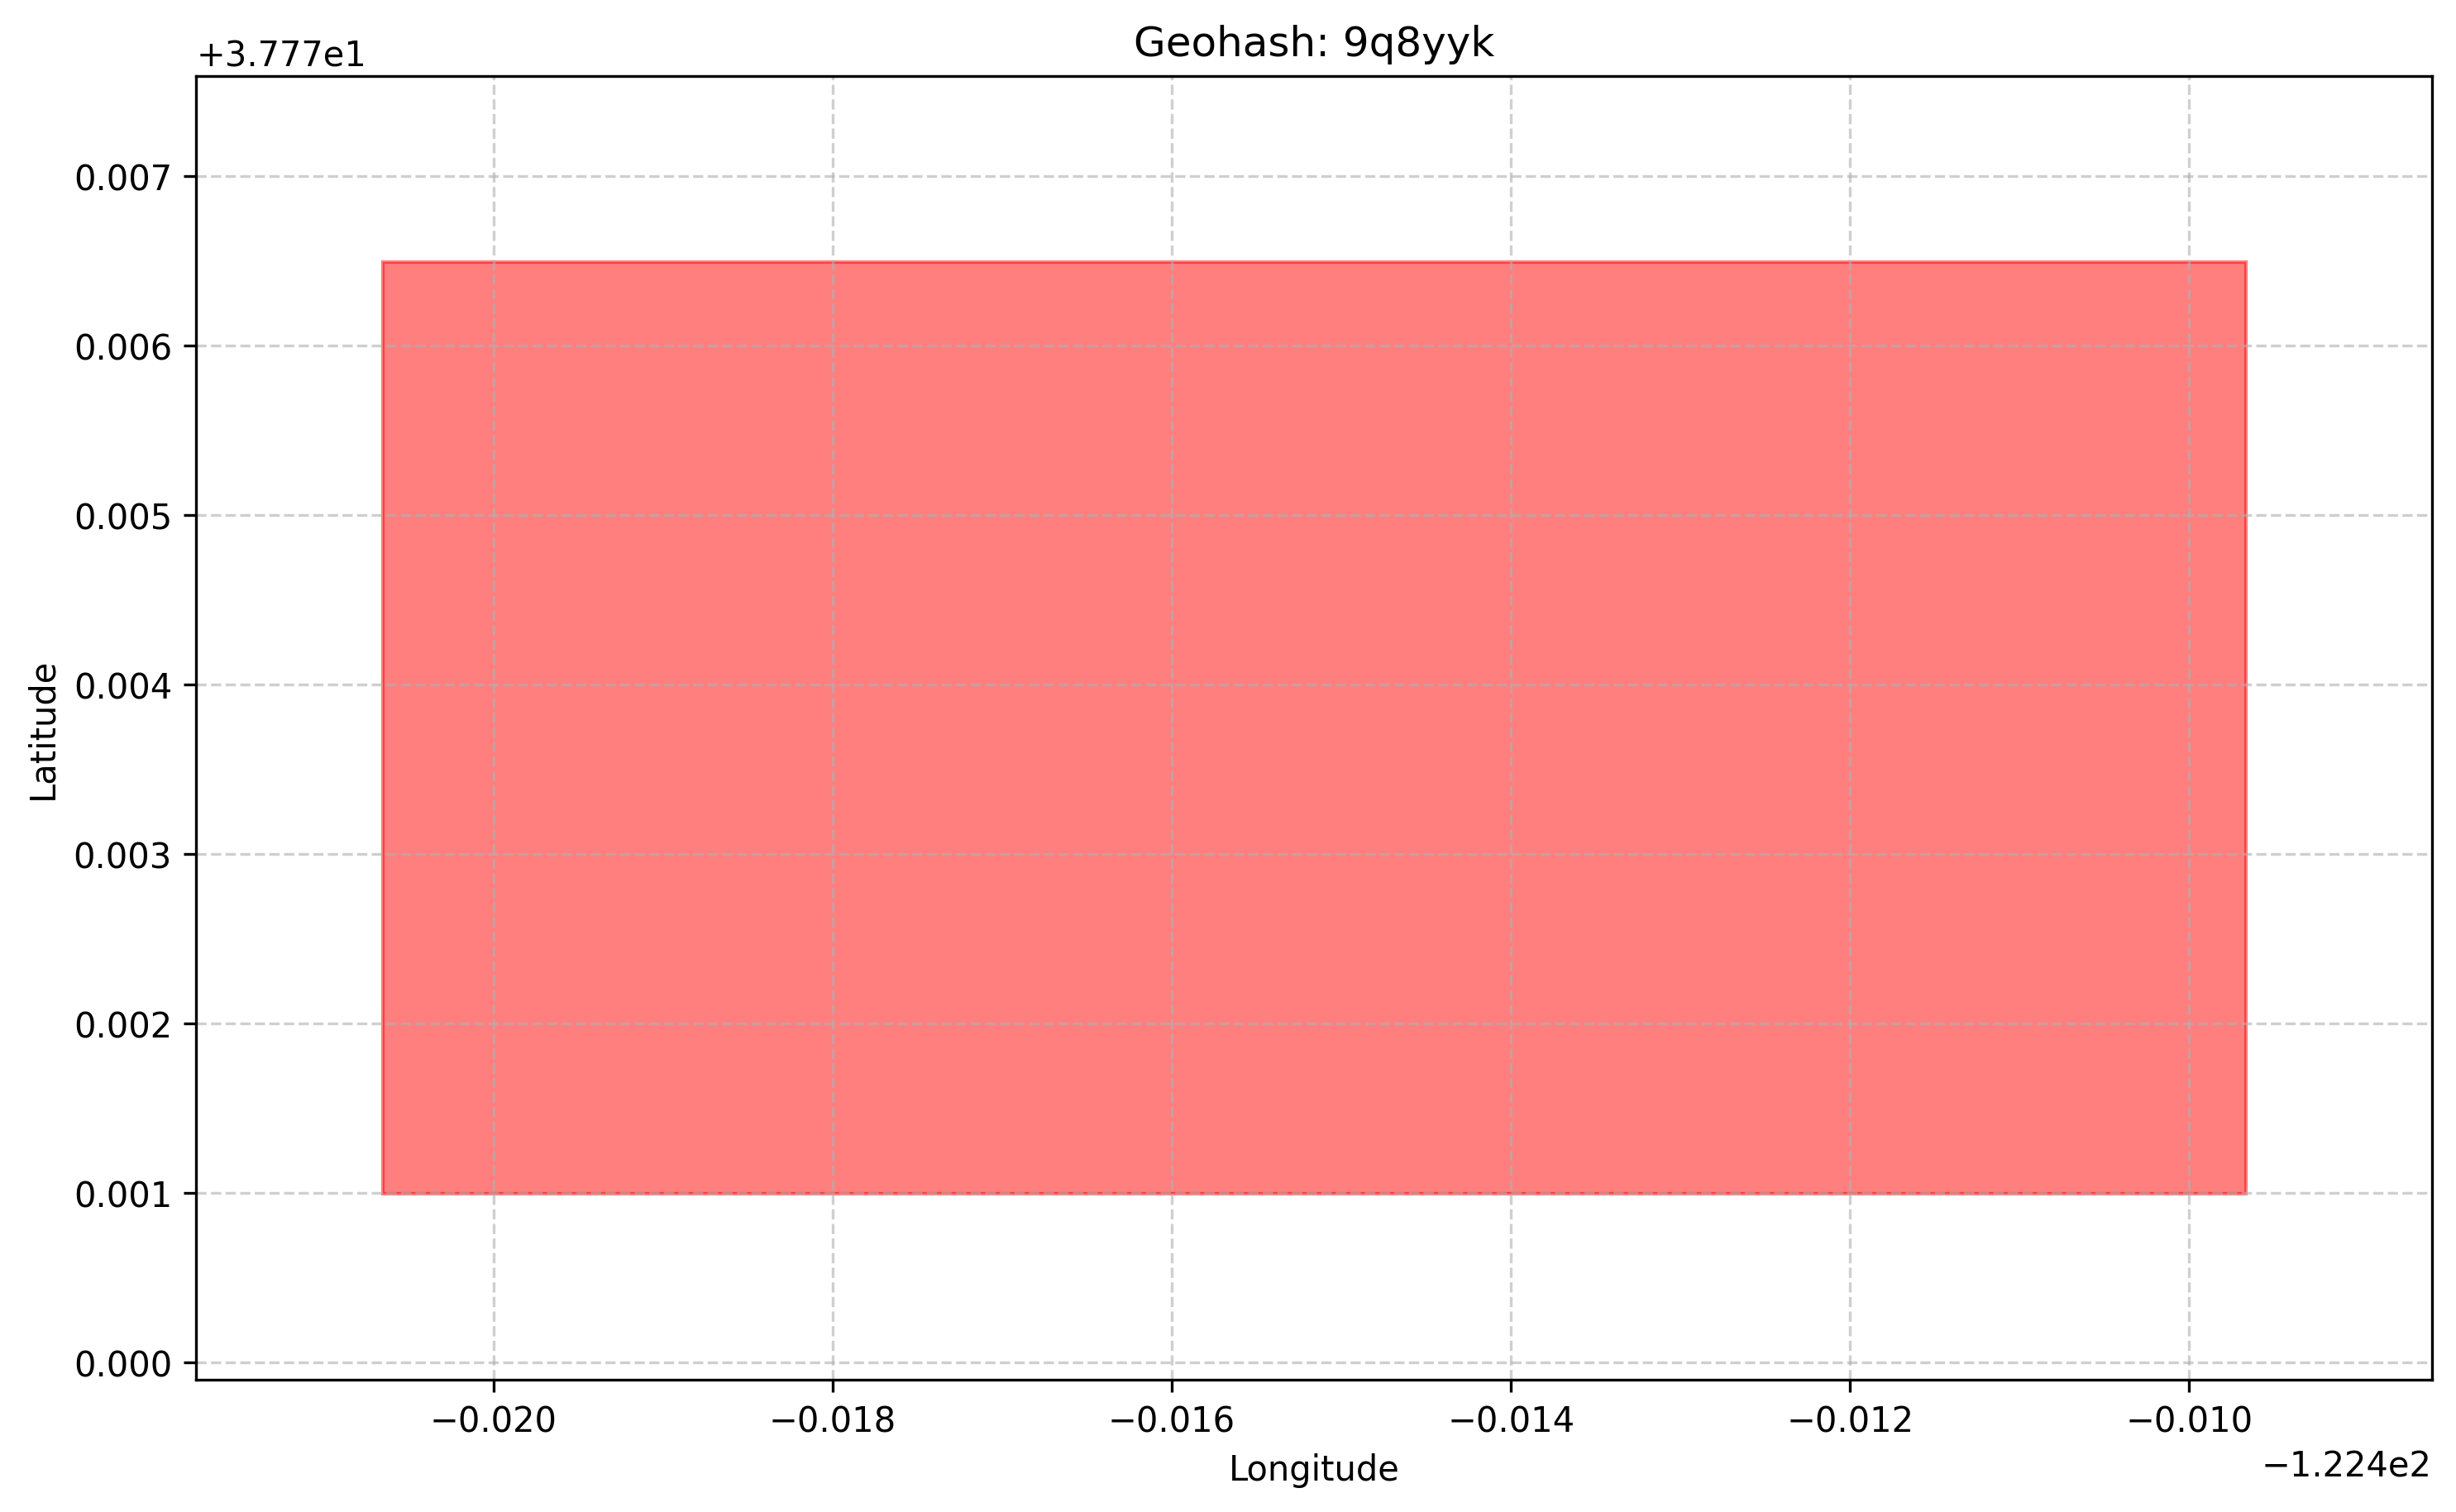
A single geohash (9q8yyk) plotted on a map
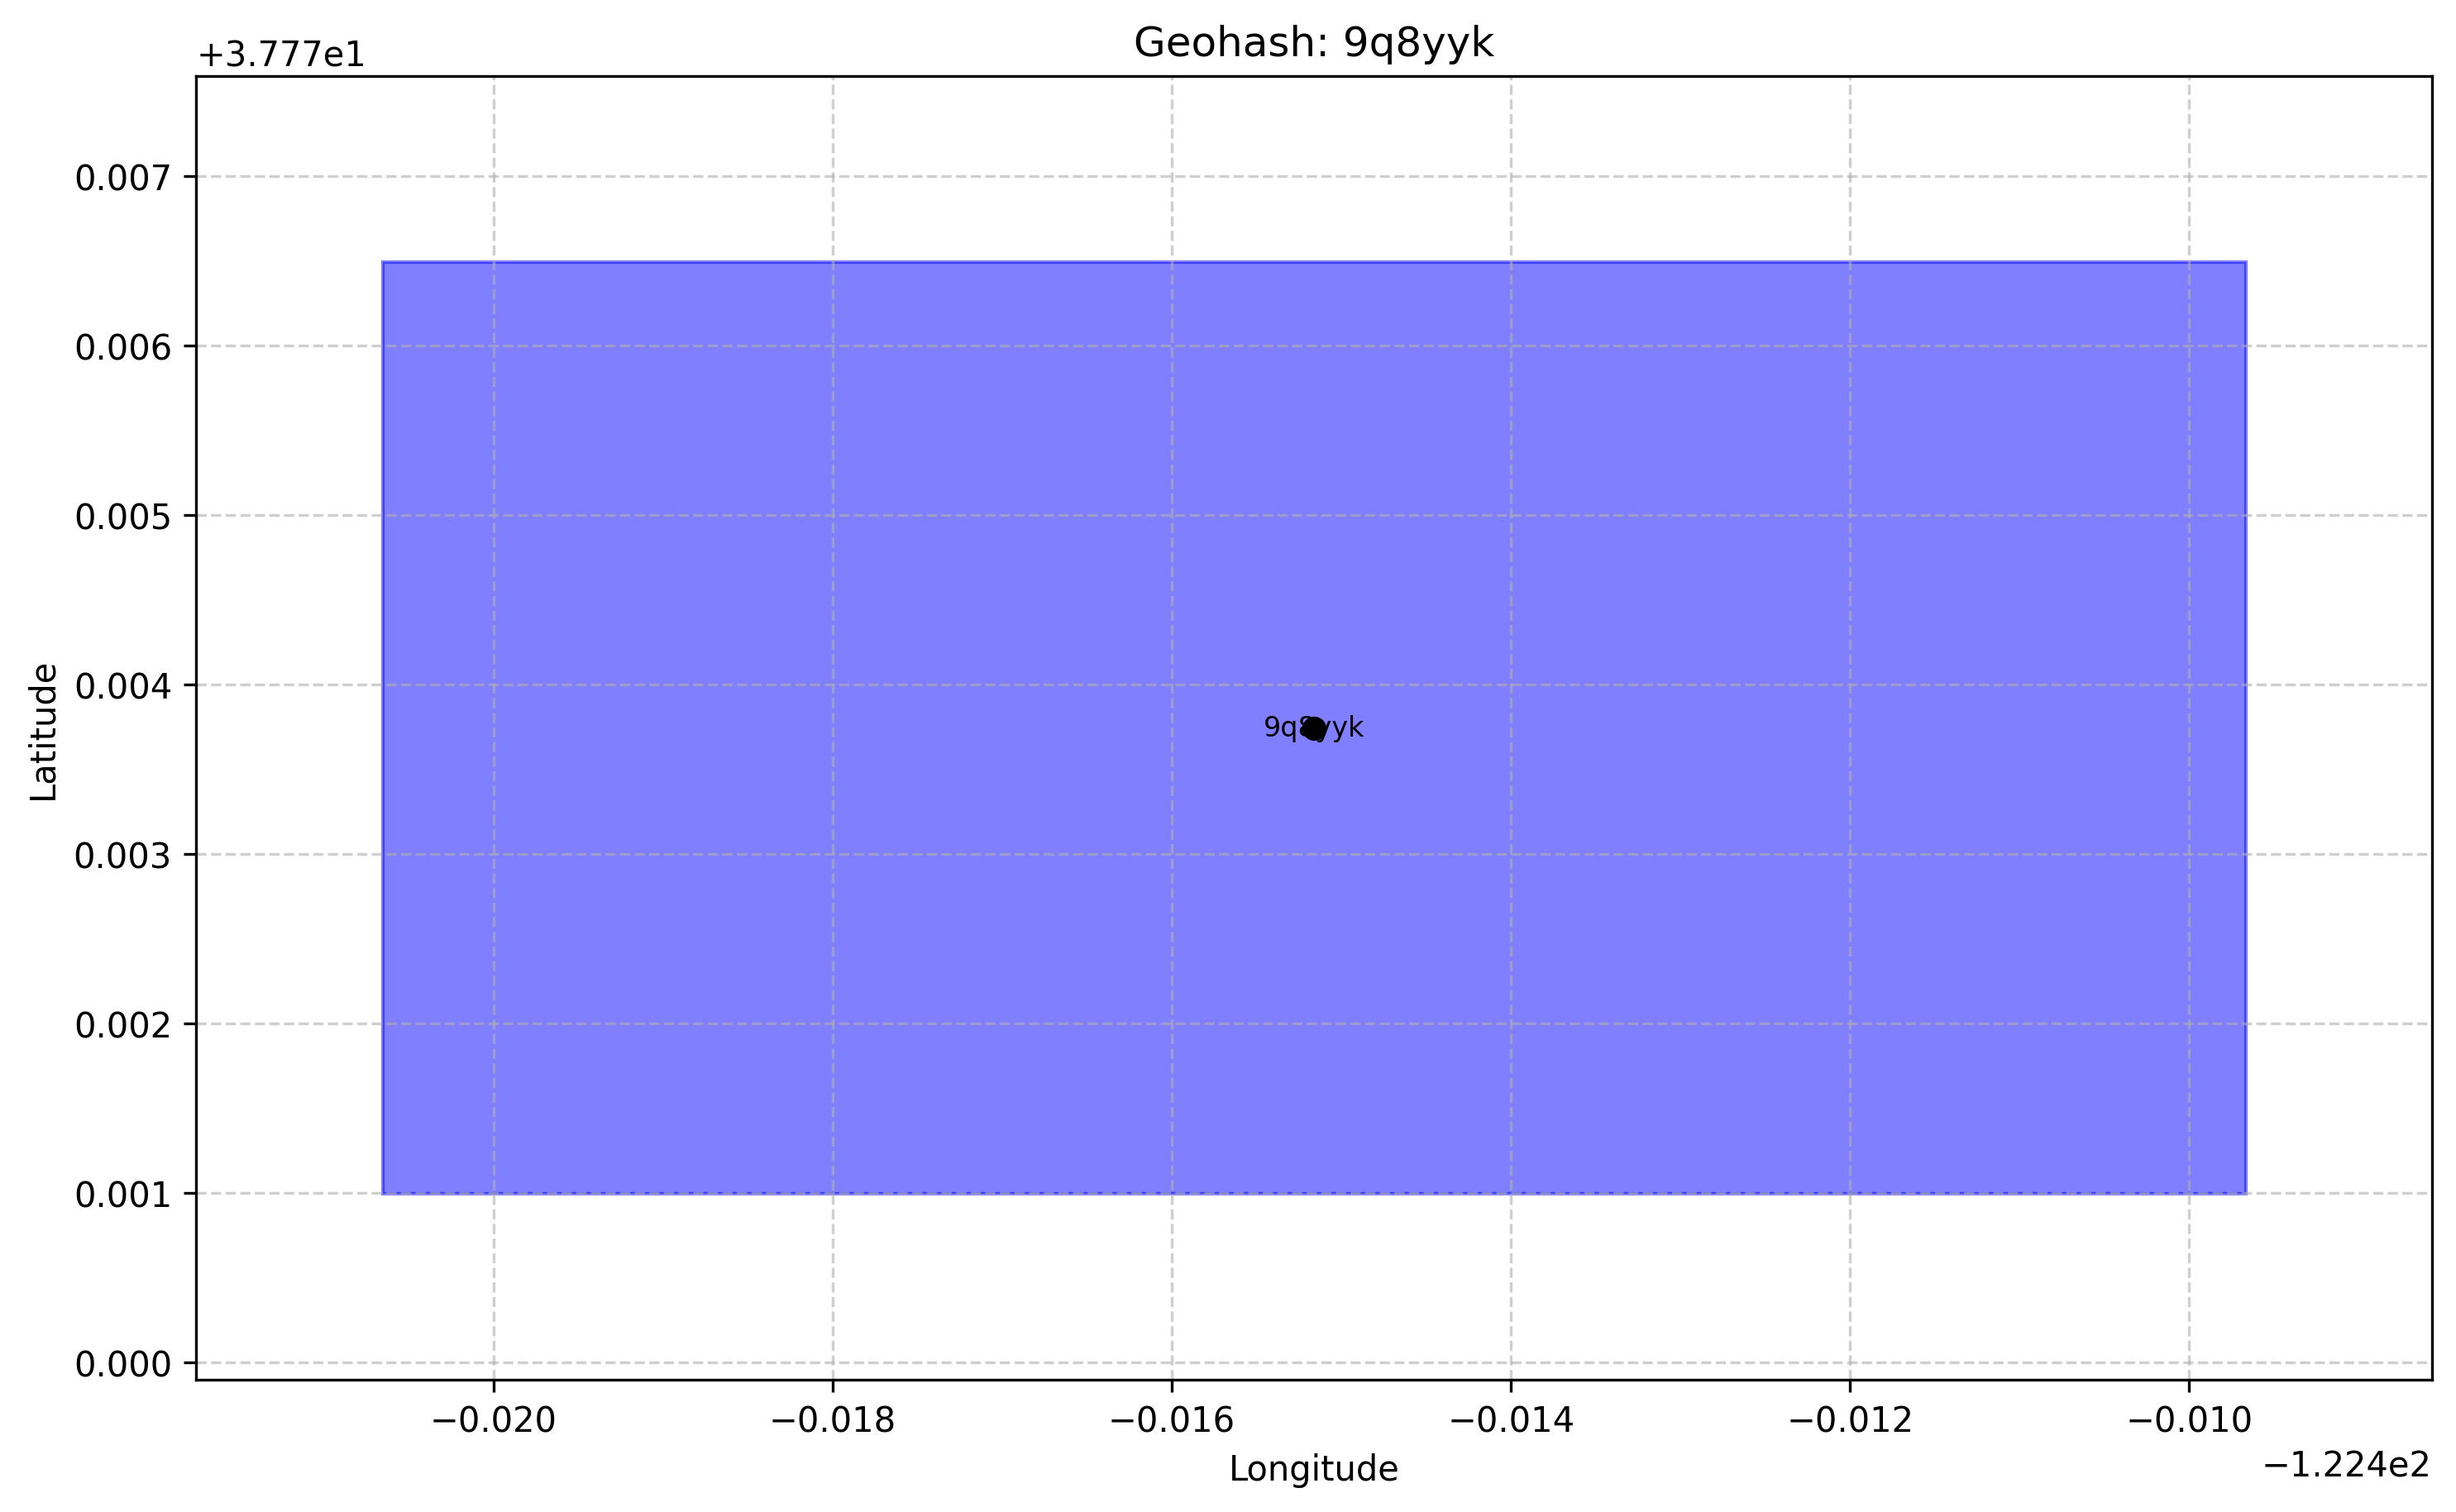
A single geohash with its center point and label displayed
import pygeohash as pgh
from pygeohash.viz import plot_geohashes
import matplotlib.pyplot as plt

# Plot multiple geohashes with default colormap
geohashes = ["9q8yyk", "9q8yym", "9q8yyj", "9q8yys"]
fig, ax = plot_geohashes(geohashes)
plt.show()

# Plot with custom colors and labels
fig, ax = plot_geohashes(
    geohashes,
    labels=["Home", "Work", "Park", "Store"],
    show_labels=True,
    colors=["red", "blue", "green", "orange"]
)
plt.show()
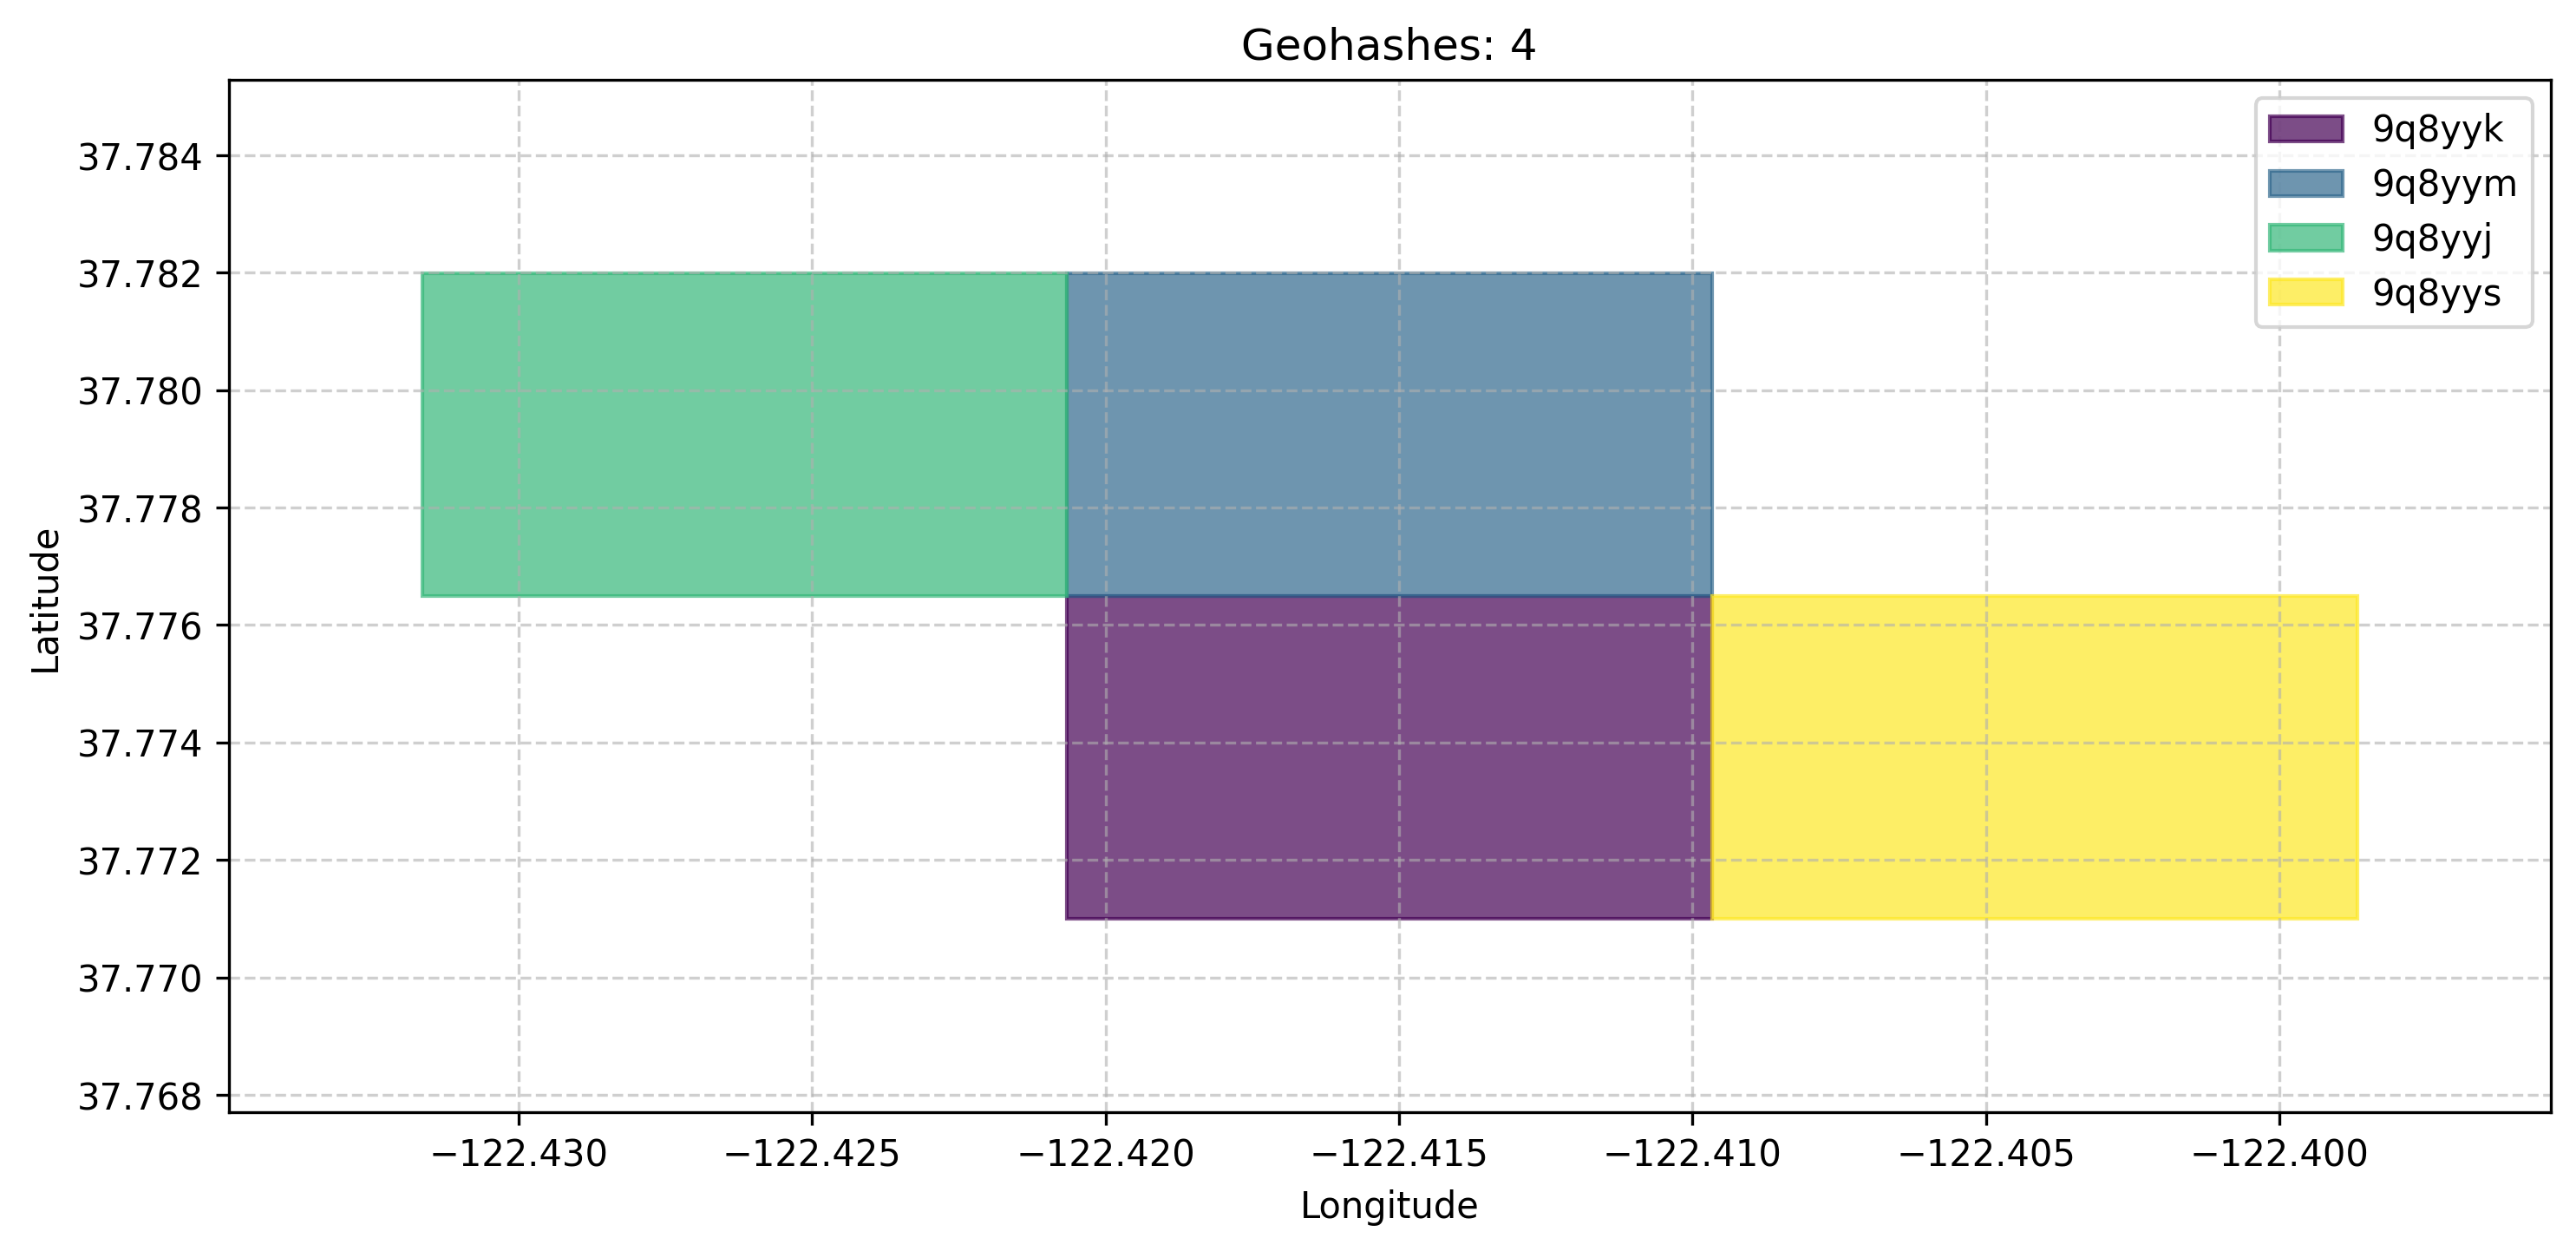
Multiple geohashes plotted on a map with different colors
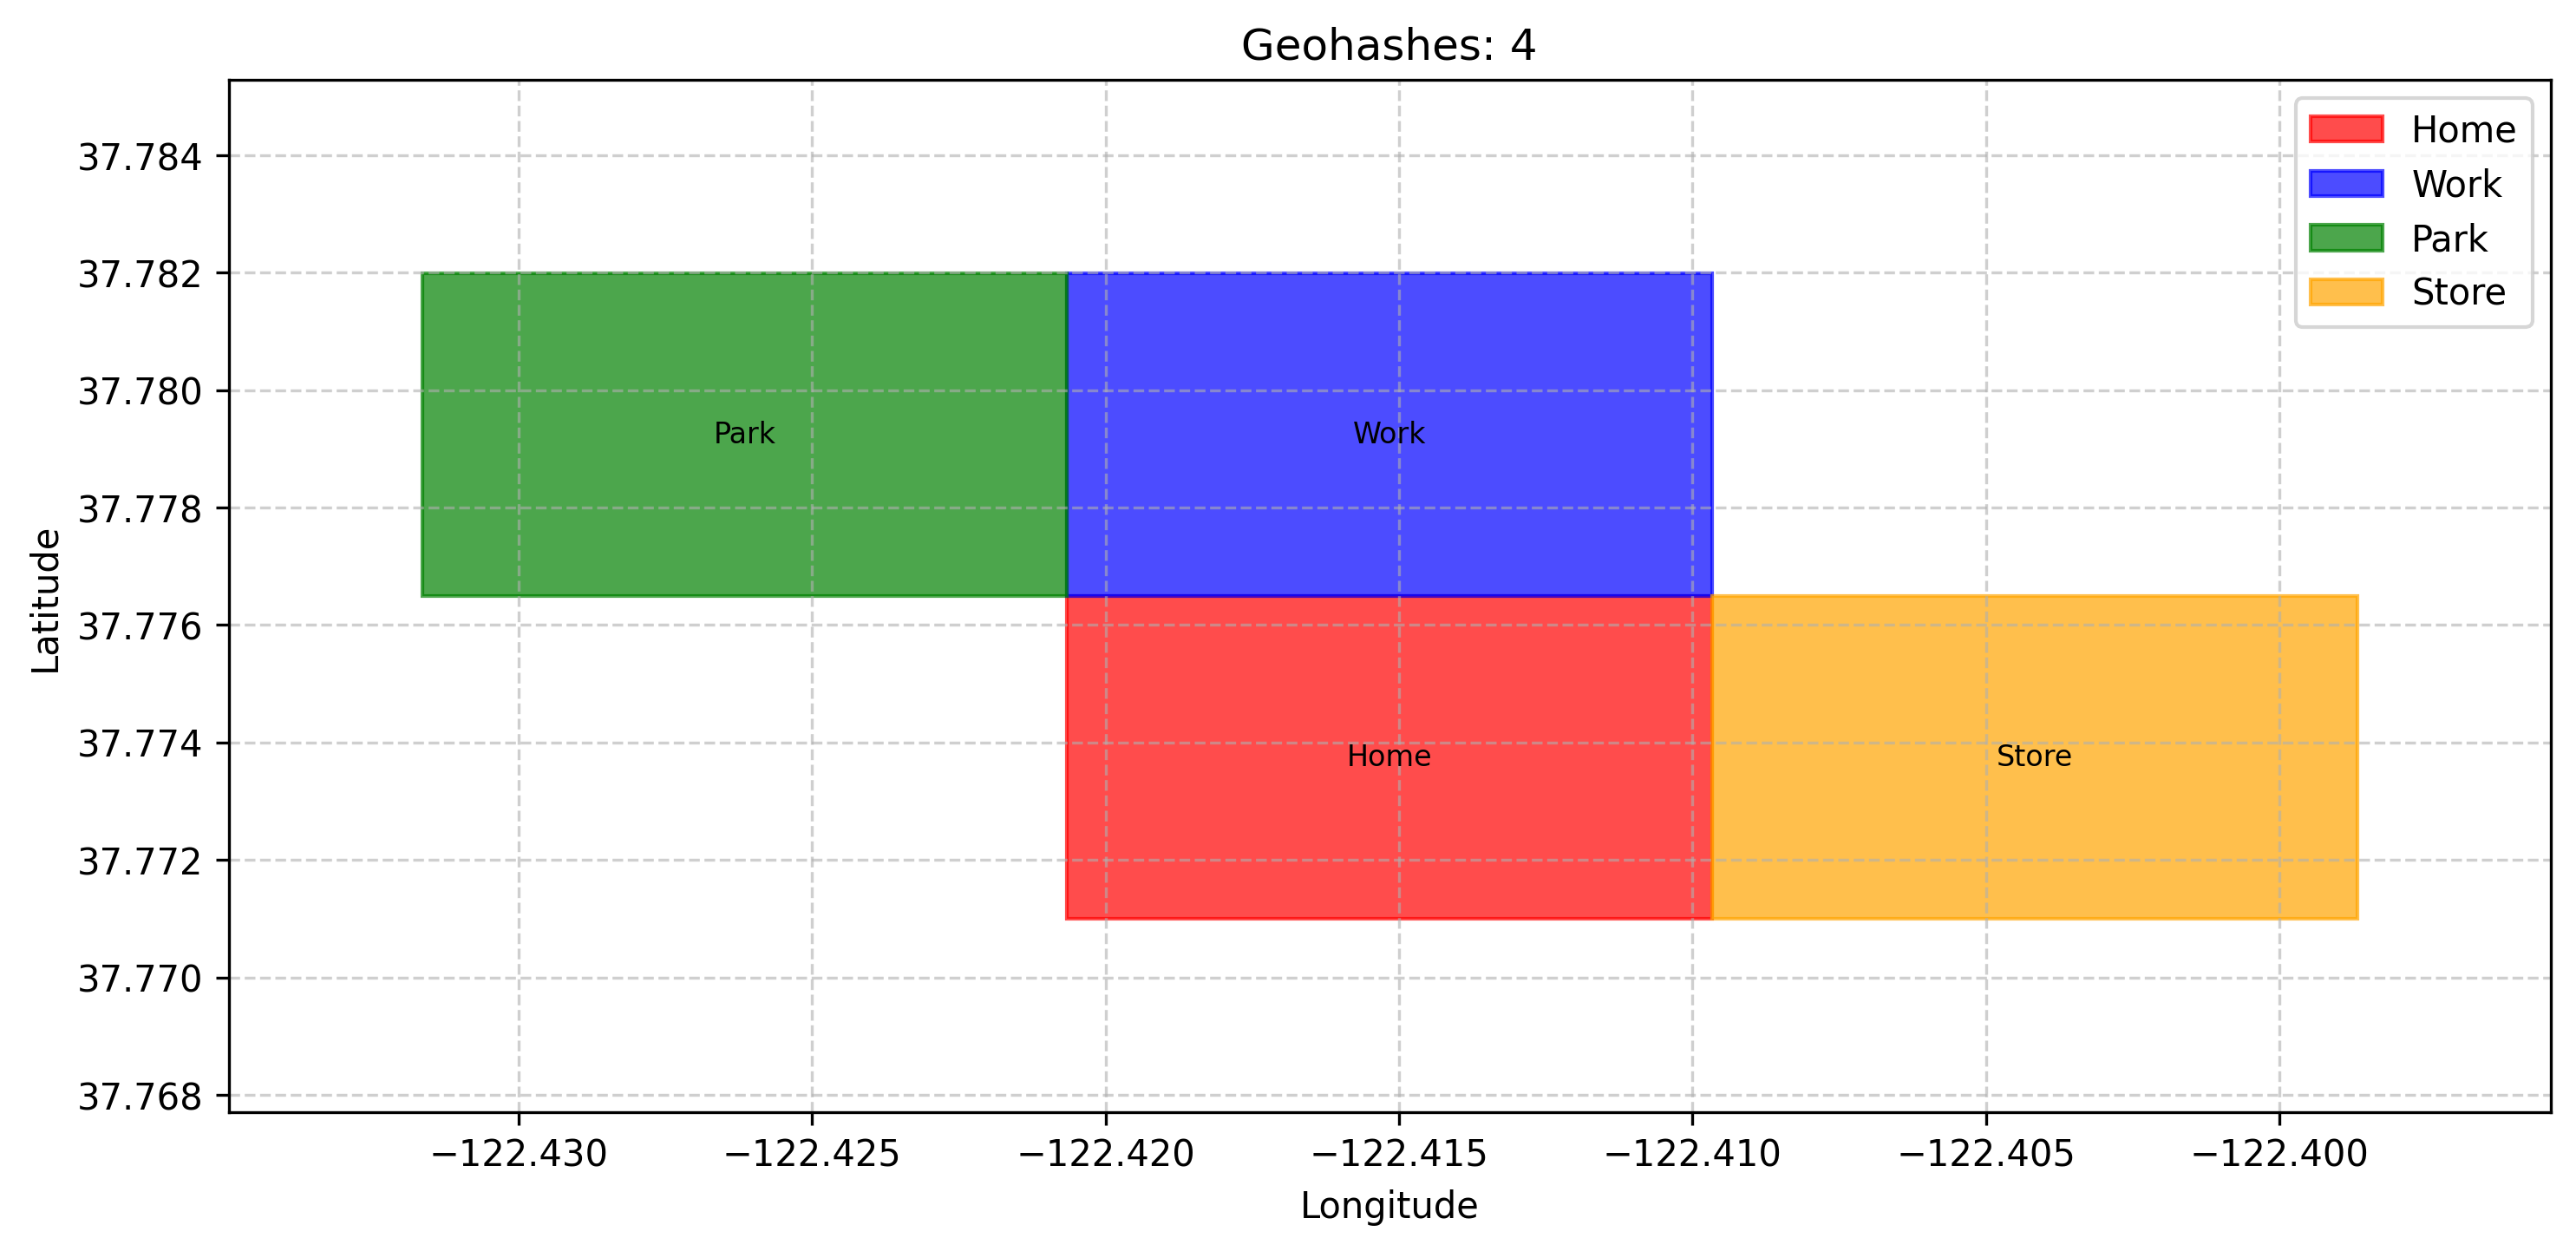
Multiple geohashes with custom labels and colors
import pygeohash as pgh
from pygeohash.viz import folium_map

# Create a map centered on a geohash
m = folium_map(center_geohash="9q8yyk", zoom_start=15)

# Add a single geohash
m.add_geohash("9q8yyk", color="red", popup="Home")

# Add multiple geohashes with different colors
m.add_geohashes(
    ["9q8yym", "9q8yyj", "9q8yys"],
    colors=["blue", "green", "orange"],
    popups=["Work", "Park", "Store"]
)

# Save the map to an HTML file
m.save("folium_map.html")
import pygeohash as pgh
from pygeohash.viz import folium_map

# Create a map
m = folium_map(center_geohash="9q8y", zoom_start=12)

# Add a geohash grid at precision 5
m.add_geohash_grid(precision=5, fill_opacity=0.2)

# Save the map to an HTML file
m.save("folium_grid.html")
import pygeohash as pgh
from pygeohash.viz import plot_geohashes
import matplotlib.pyplot as plt

# Get a geohash and its neighbors
center = "9q8yyk"
neighbors = {
    "North": pgh.get_adjacent(center, "top"),
    "East": pgh.get_adjacent(center, "right"),
    "South": pgh.get_adjacent(center, "bottom"),
    "West": pgh.get_adjacent(center, "left")
}

# Plot the center and its neighbors
all_geohashes = [center] + list(neighbors.values())
labels = ["Center"] + list(neighbors.keys())

fig, ax = plot_geohashes(
    all_geohashes,
    labels=labels,
    show_labels=True,
    colors=["red"] + ["blue"] * len(neighbors)
)
plt.show()
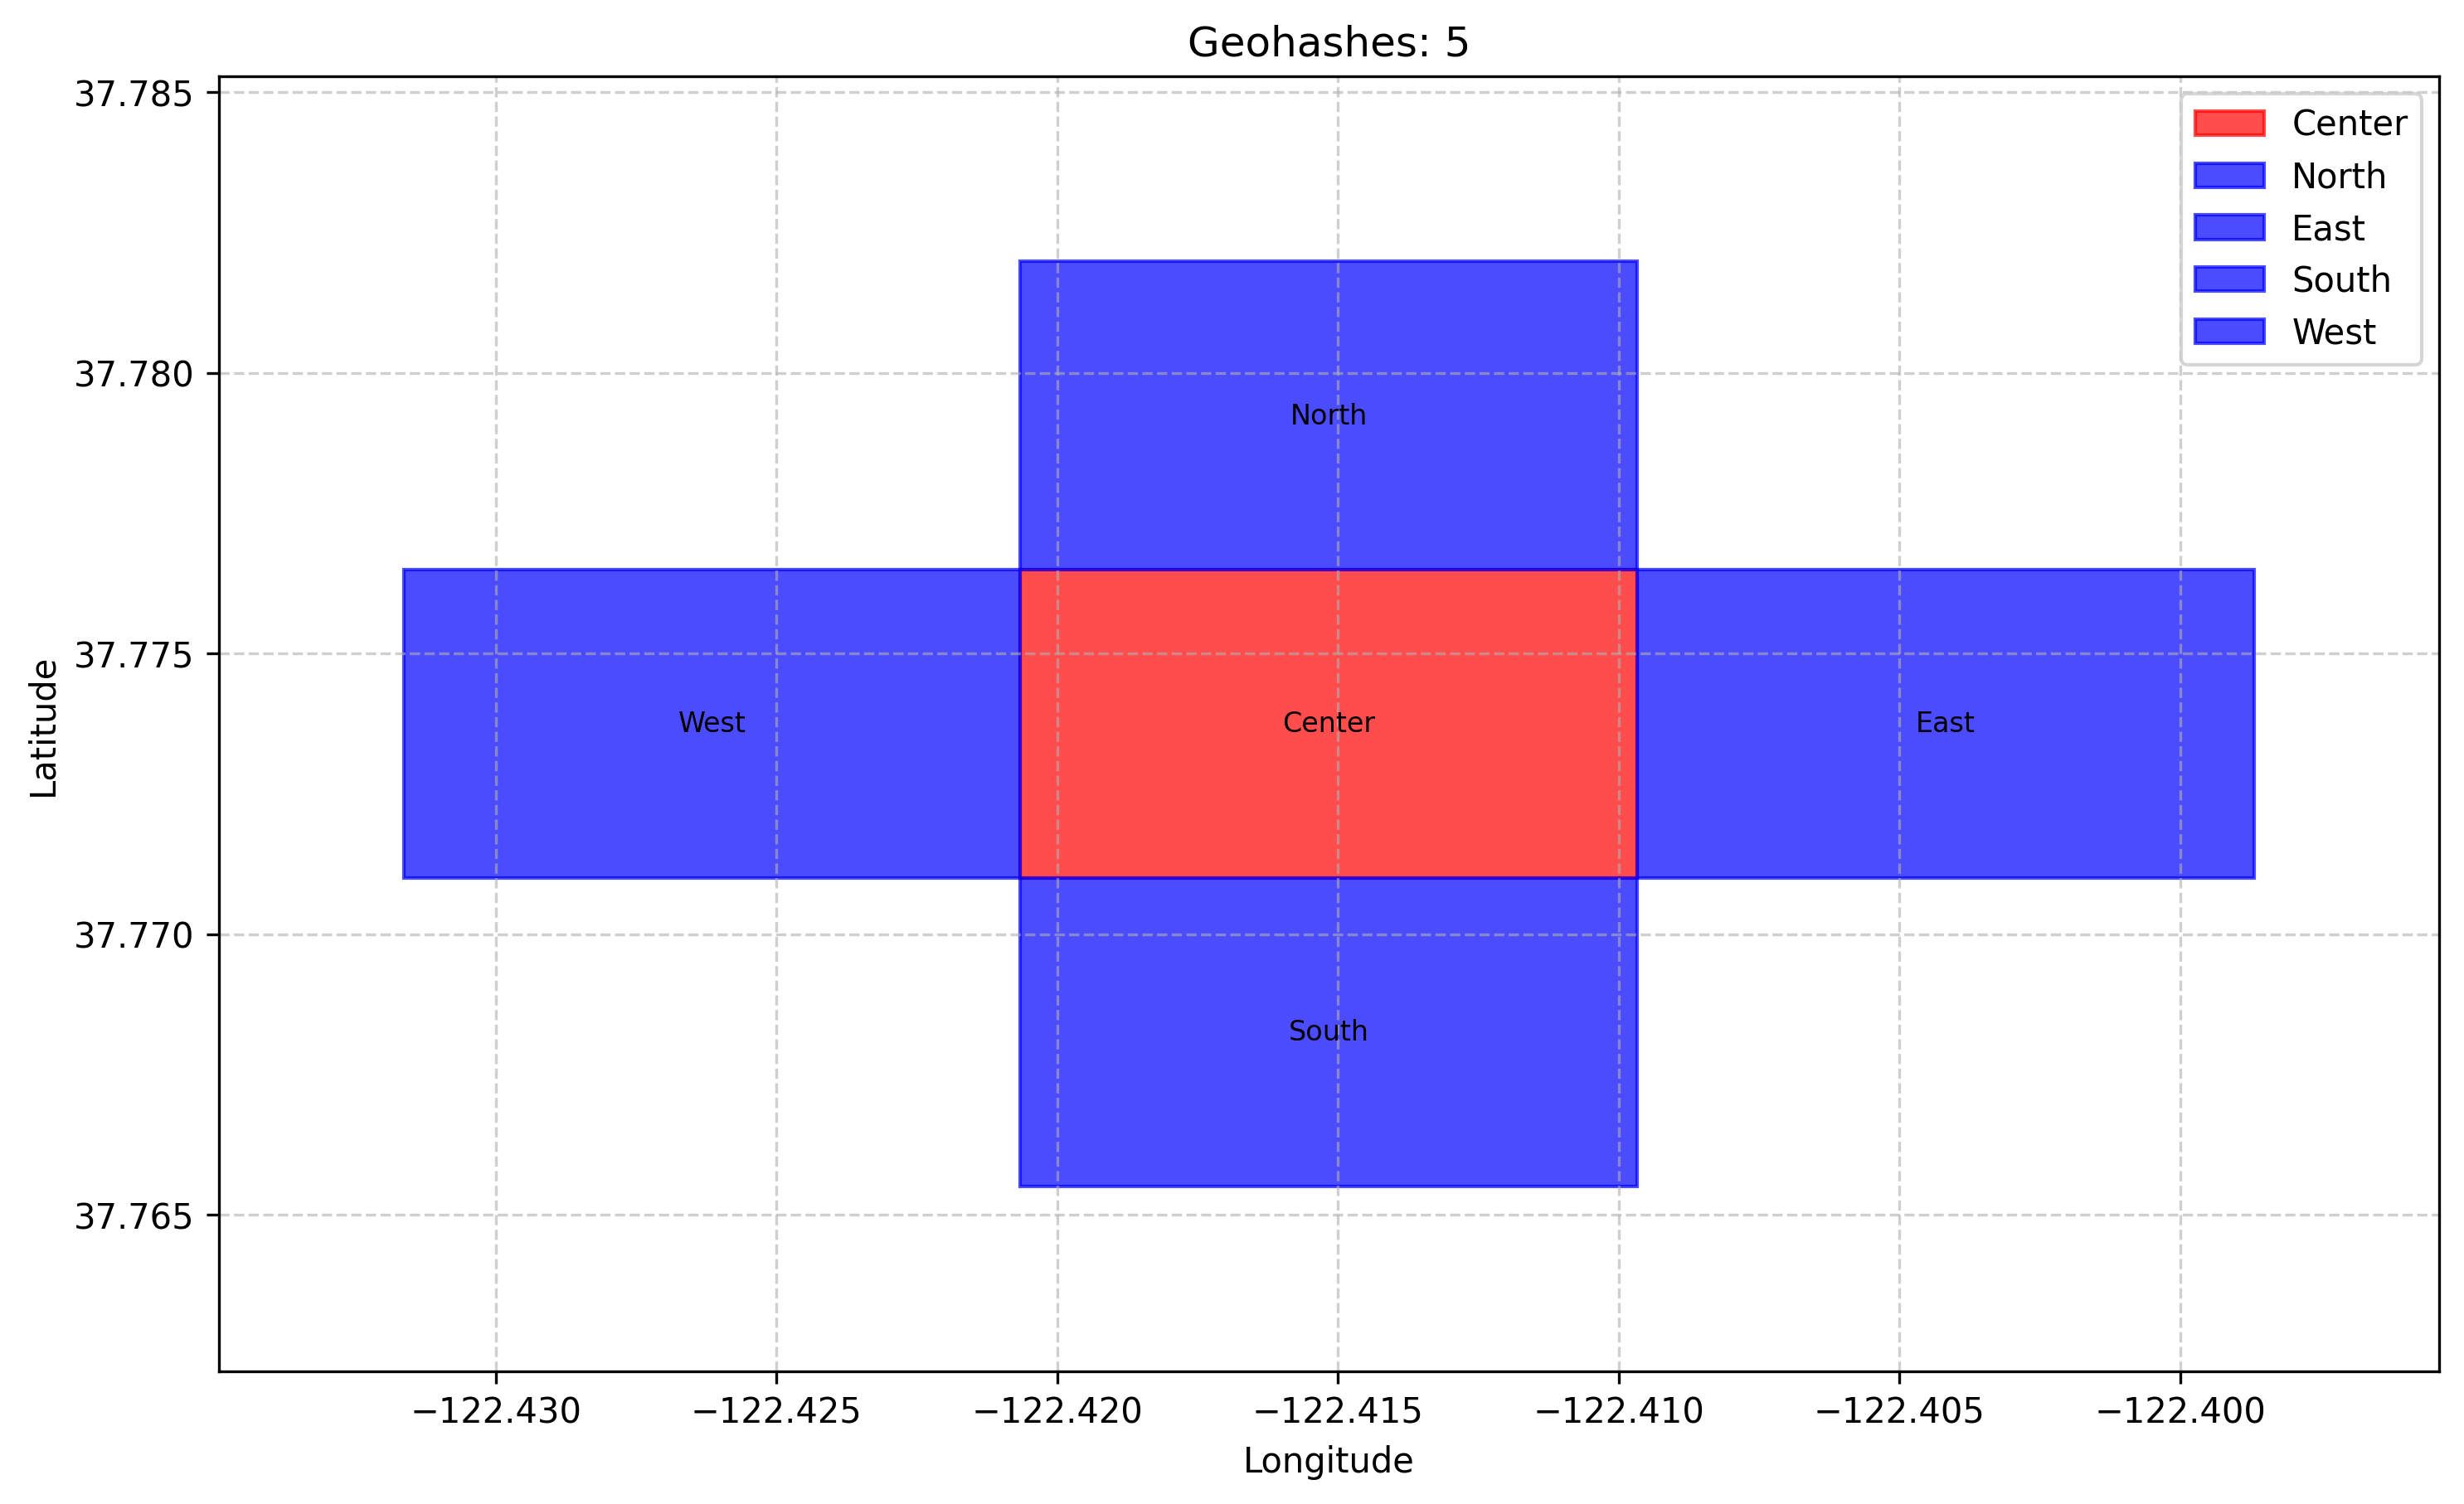
A geohash (center) and its neighboring geohashes
import pygeohash as pgh
from pygeohash.viz import plot_geohashes
import matplotlib.pyplot as plt

# Start with a precision 4 geohash
base_geohash = "9q8y"

# Generate geohashes at different precisions
geohashes = [
    base_geohash,
    base_geohash + "y",
    base_geohash + "yk",
]

labels = [f"Precision {len(gh)}" for gh in geohashes]

fig, ax = plot_geohashes(
    geohashes,
    labels=labels,
    show_labels=True,
    colors=["red", "green", "blue"],
    alpha=0.5
)
plt.show()
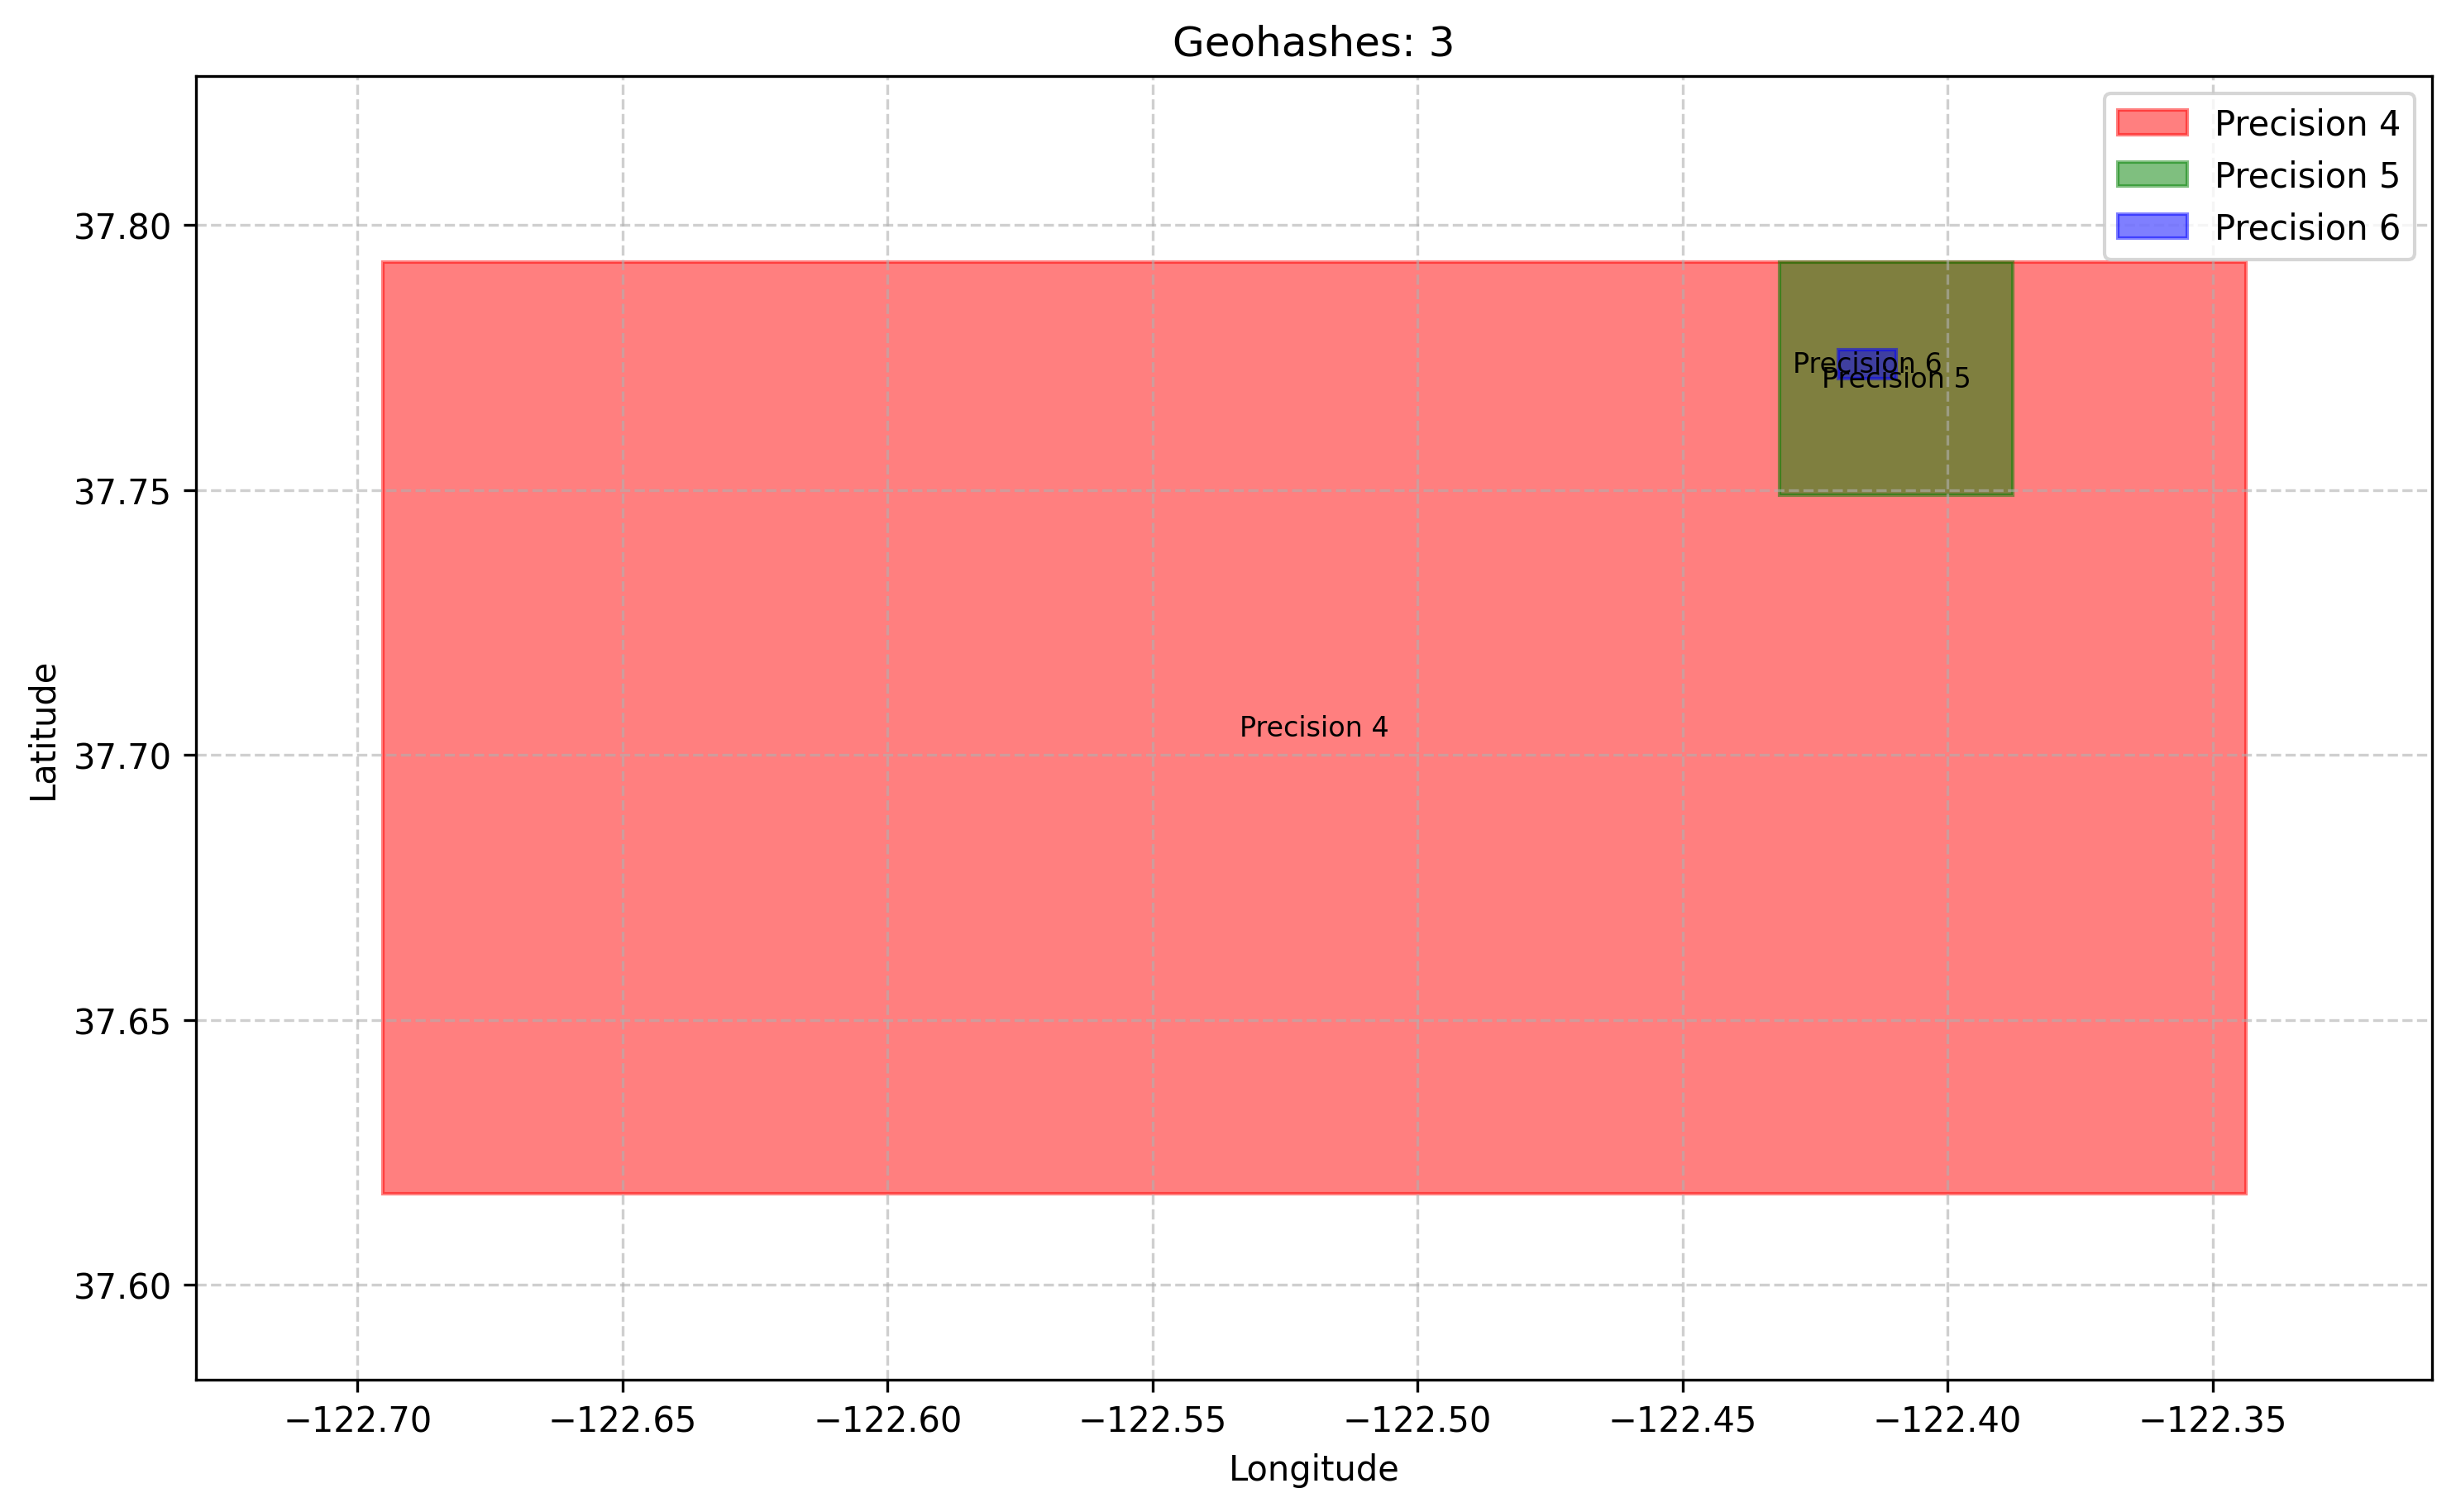
Geohashes at different precision levels (4, 5, and 6)